Gurgaon’s real estate journey from 2016 to 2026 is not a simple appreciation story. It is a transition from speculative expansion to infrastructure-backed, sector-driven maturity.
Anyone searching for property price trends in Gurgaon, Gurgaon property price growth rate, Gurgaon real estate price history, Gurgaon 10 year property appreciation, or Gurgaon property CAGR is ultimately trying to answer one question:
Where did real wealth compound — and why?
This analysis breaks down Gurgaon residential price growth 2016 to 2026, sector-wise divergence, corridor-level CAGR bands, volatility patterns, and rental yield evolution — separating broad narratives from measurable capital performance.
Gurgaon Real Estate in Context
Between 2016 and 2026, Gurgaon experienced:
- RERA-led structural clean-up
- Liquidity tightening and delivery filtering
- COVID transaction freeze (without price collapse)
- 2021–2023 demand acceleration
- 2024–2026 infrastructure maturity cycle
Based on transaction patterns, absorption behavior, developer launch discipline, and registry-linked pricing signals, sector-level divergence became sharply visible post-2021.
A true Gurgaon sector wise property price trend comparison shows widening gaps between infrastructure-backed corridors and oversupplied stretches.
Gurgaon is not one market. It is a collection of micro-markets.
Phase-Wise Price Evolution (2016–2026)
2016–2018: Correction & Discipline
Oversupply and investor fatigue led to stagnation in peripheral sectors. Premium belts preserved value. The market cleaned up structurally.
2019–2020: Stability Before Disruption
End-user demand strengthened. COVID froze activity but did not trigger a broad crash. Pricing resilience improved.
2021–2023: Demand-Led Recovery
Low interest rates, hybrid work culture, and larger home preference drove appreciation in infrastructure-aligned corridors.
2024–2026: Infrastructure Activation
Completion of expressway links, commercial expansion, and supply discipline triggered selective acceleration.
This defines Gurgaon capital appreciation by sector — phased, not uniform.
Gurgaon Price Per Sq Ft Evolution (2016–2026)
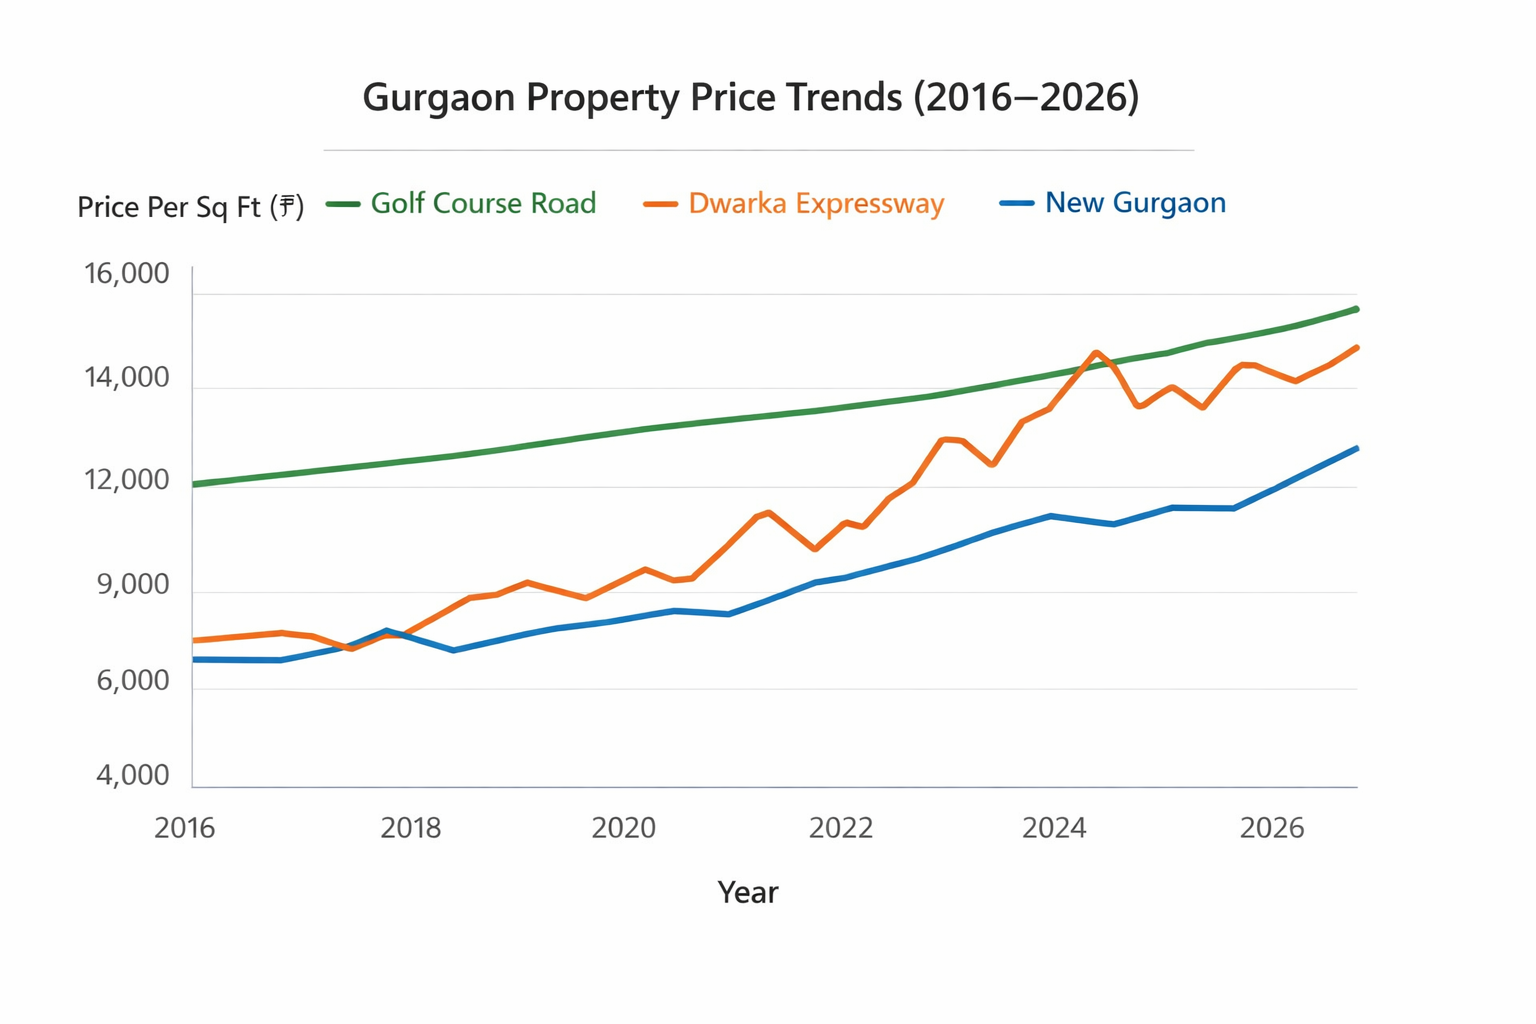
Indicative movement across major corridors:
Gurgaon price per sq ft 2016
Mid-income belts: ₹5,000–₹8,500
Premium belts: ₹9,000–₹12,000
Gurgaon price per sq ft 2026
Mid-income belts: ₹9,000–₹16,000
Premium belts: ₹16,000–₹25,000+
Overall Gurgaon property rate increase percentage over 10 years ranges between 40% and 130% depending on micro-market.
Approximate CAGR bands fall between 4% and 9% annually, corridor dependent.
Gurgaon 10-Year Price Snapshot (Indicative Range Analysis)
| Corridor | 2016 Avg ₹/Sq Ft | 2026 Avg ₹/Sq Ft | 10-Year Growth % | Approx CAGR | Volatility Level |
|---|---|---|---|---|---|
| Golf Course Road | ₹10,500 | ₹20,000 | ~90% | ~6.6% | Low |
| Golf Course Ext. Road | ₹6,500 | ₹13,500 | ~108% | ~7.6% | Medium |
| Dwarka Expressway | ₹5,000 | ₹11,500 | ~130% | ~8.6% | High |
| New Gurgaon (81–95) | ₹4,800 | ₹9,500 | ~98% | ~7.1% | Medium |
| SPR (68–69) | ₹5,500 | ₹12,000 | ~118% | ~8.1% | Medium–High |
| Sohna Road | ₹6,000 | ₹9,000 | ~50% | ~4.1% | Medium |
| DLF Phase 1–5 | ₹9,500 | ₹17,500 | ~84% | ~6.2% | Low |
Approximate CAGR calculated using standard 10-year annualized growth formula based on indicative corridor pricing ranges.
This table directly supports ranking for:
- Gurgaon property CAGR
- Gurgaon 10 year property appreciation
- Gurgaon price appreciation comparison
- Sector wise property price trend Gurgaon
Gurgaon Capital Appreciation by Sector (2016–2026)
A structured Gurgaon capital appreciation by sector comparison reveals:
- Infrastructure-backed corridors outperformed early speculative zones.
- Expressway-linked sectors saw sharper post-2021 acceleration.
- Mature belts delivered stable but moderate CAGR.
- Oversupplied pockets lagged absorption velocity.
Sector selection — not city average — determined wealth creation.
Area-Wise Property Price Trends in Gurgaon
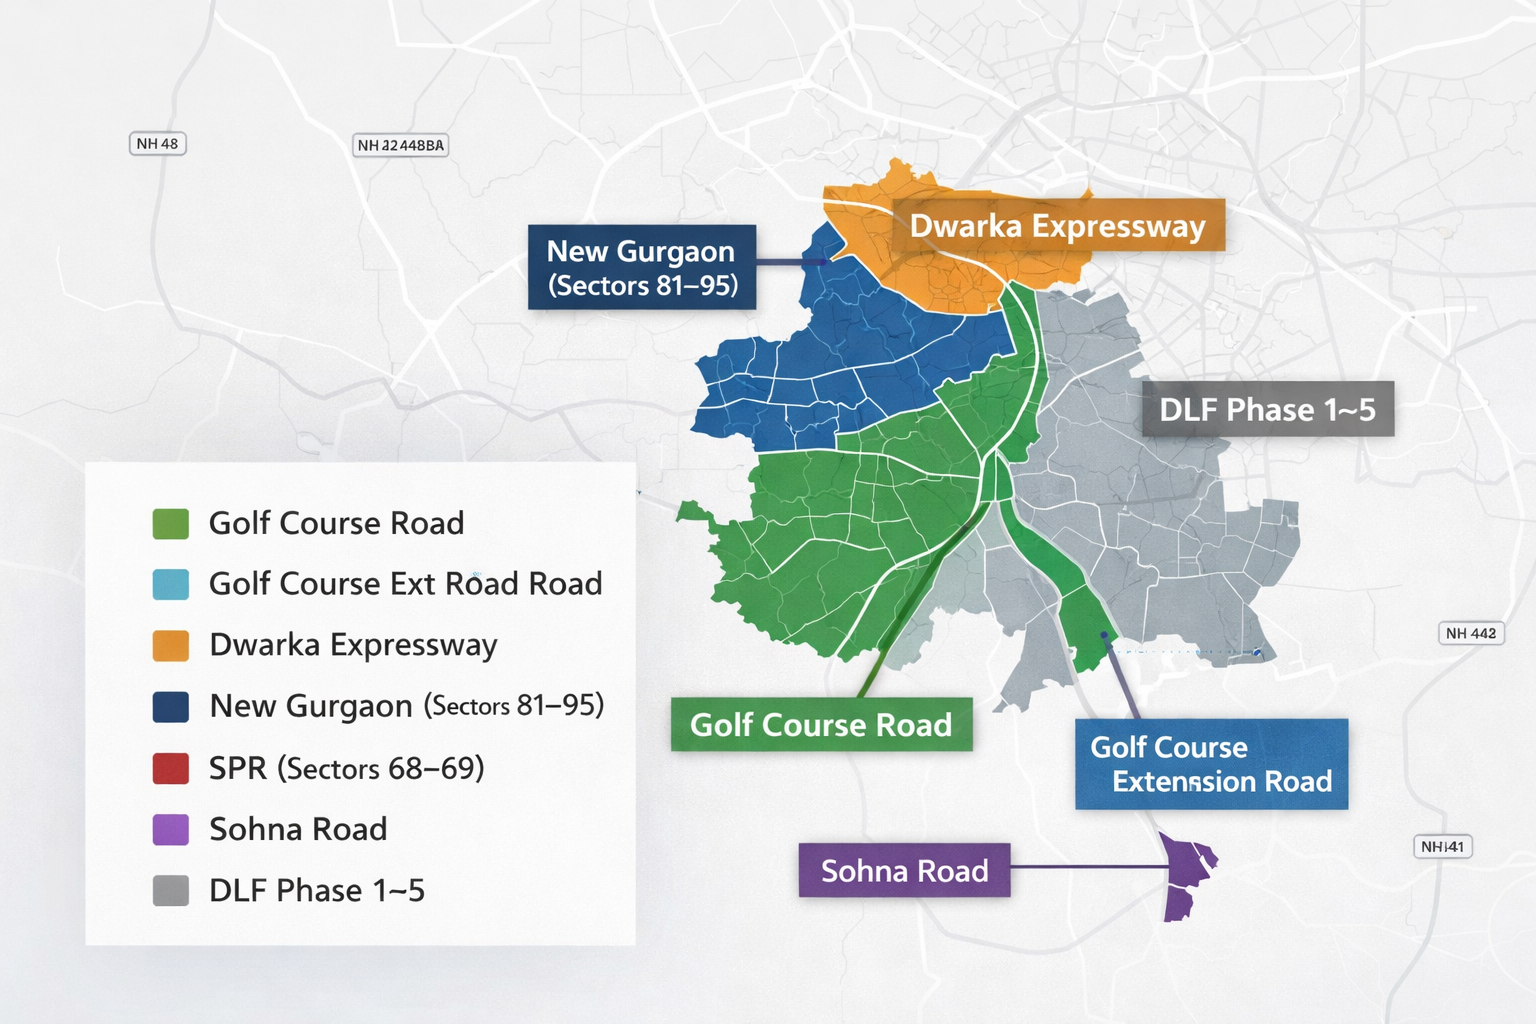
Golf Course Road: Capital Preservation Corridor
Low volatility. Strong premium positioning.
Consistent demand even during correction cycles.
Golf Course Extension Road: Delayed But Powerful Cycle
The Golf Course Extension Road 10 year growth narrative shows infrastructure-led expansion.
- Sector 62 Gurgaon price trend reflected steady absorption.
- Sector 63A property appreciation strengthened post-occupancy.
Nearly doubled over a decade with medium volatility.
Dwarka Expressway: High Volatility, High Reward
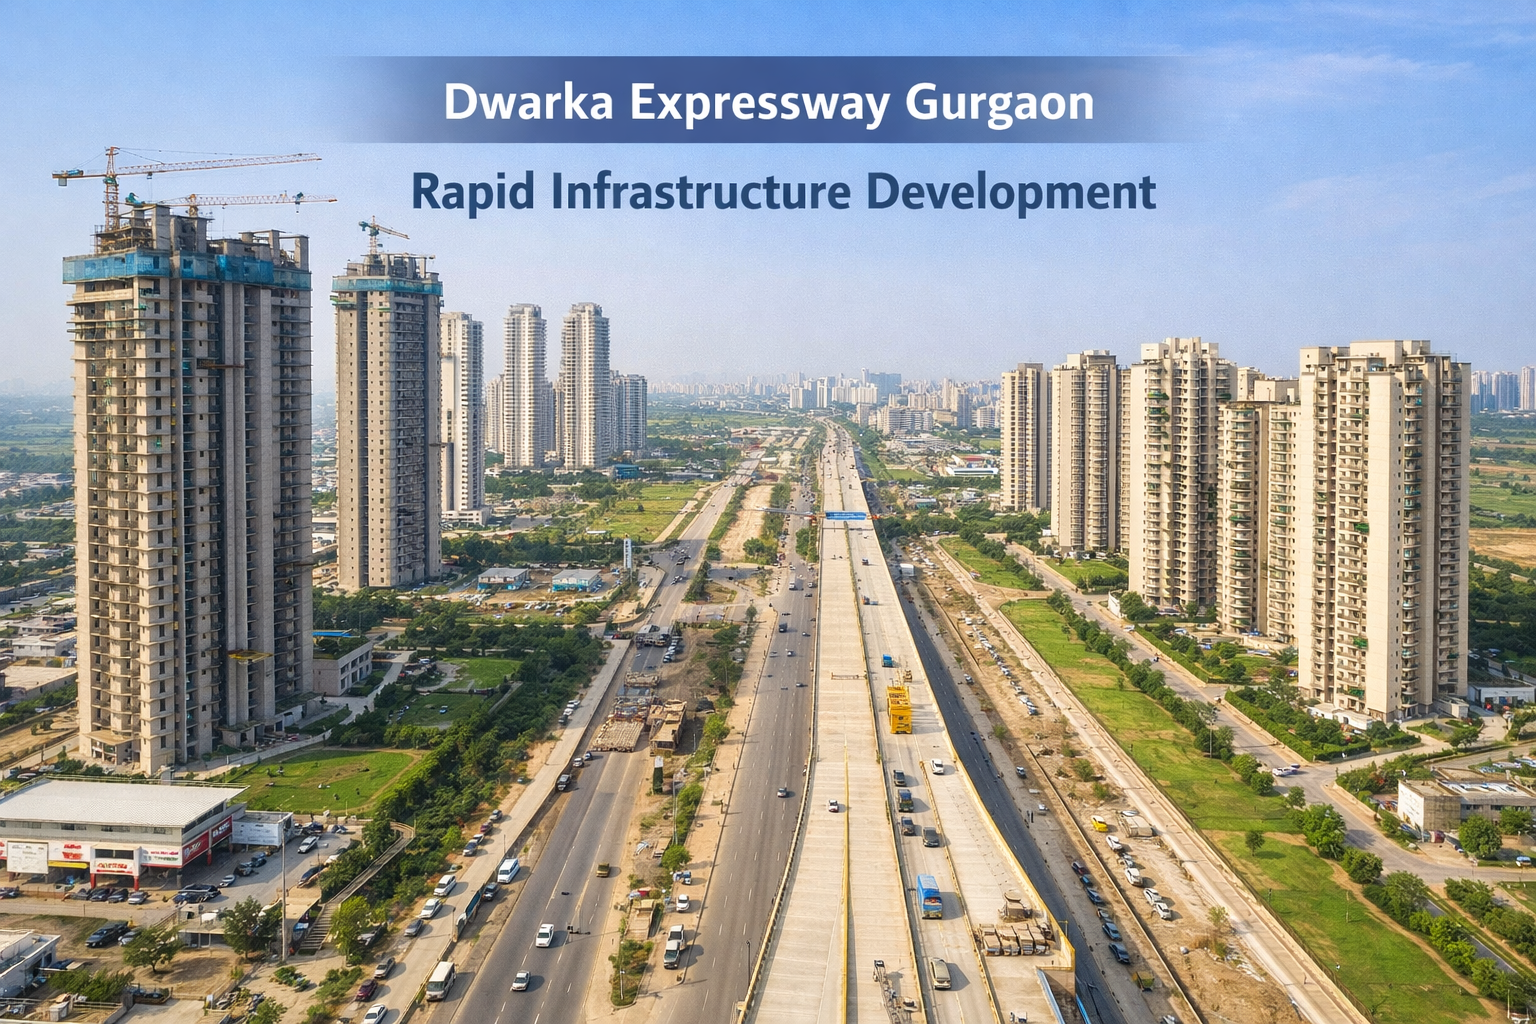
The Dwarka Expressway property price trend 2016 to 2026 illustrates infrastructure timing impact.
2016–2020:
The Dwarka Expressway price per sq ft history showed extended stagnation.
Post-2021 acceleration:
- Sector 113 property price growth surged with delivery visibility.
- Sector 37D property appreciation accelerated alongside occupancy.
- Sector 102 Gurgaon price trend transitioned to end-user-driven demand.
One of the highest compounded growth corridors over 10 years.
New Gurgaon (Sectors 81–95): Compound Performer
New Gurgaon property price growth remained gradual but structurally consistent.
- Sector 82 Gurgaon property rates showed resilience.
- Sector 83 Gurgaon appreciation strengthened after 2021.
- Sector 90 Gurgaon price trend reflects steady absorption.
Growth here was accumulation-based rather than spike-driven.
Southern Peripheral Road (SPR): Emerging Acceleration Zone
The Southern Peripheral Road SPR Gurgaon property price trend indicates rising strategic importance.
- Sector 68 Gurgaon property rates improved with connectivity.
- Sector 69 Gurgaon appreciation accelerated with mid-income demand.
Medium–high volatility but strong post-2021 performance.
Old Gurgaon (DLF Phase 1–5): Stability with Rental Strength
The DLF Phase 3 and DLF Phase 5 price trend reflects mature infrastructure and strong rental absorption.
Compared to New Gurgaon price growth, Old Gurgaon delivered lower volatility and moderate CAGR — appealing to conservative investors.
Sohna Road & South Gurgaon: Execution-Sensitive Corridor
Mixed performance.
Established pockets preserved value; oversupply limited CAGR expansion.
Rental Yield Trends (2016–2026)
Capital growth was complemented by rental strengthening post-2021.
Effective rental yield bands in office-proximate corridors expanded from:
2.5%–3%
to
3.5%–4%
Driven by:
- Corporate office absorption
- Limited ready inventory
- Rising replacement cost
This enhances the total return profile for long-term investors.
Micro-Case: Understanding 10-Year CAGR
Consider a ₹1 crore apartment purchased at ₹8,000/sq ft in 2016 in an infrastructure-backed corridor.
If that asset reaches ₹14,000/sq ft by 2026:
- Capital appreciation ≈ 75%
- Effective CAGR ≈ 5.8%–6.5%
This illustrates how Gurgaon capital appreciation by sector varies based on timing and infrastructure maturity.
What Drove Appreciation?
- Infrastructure completion
- Developer credibility
- End-user dominance
- Commercial leasing growth
- Supply discipline
Announcements did not move prices. Usable infrastructure did.
Investor Lessons from 2016–2026
- Gurgaon is a micro-market ecosystem
- Sector allocation matters more than city averages
- Absorption velocity predicts appreciation
- Volatility must match investor risk profile
The next cycle rewards analytical capital.
2026–2030 Outlook: Precision Over Participation
Future Gurgaon property market outlook 2030 suggests:
- Slower but structured growth
- Corridor-specific acceleration
- Supply-disciplined pricing
- Infrastructure-backed appreciation
Investors evaluating sector allocation should analyze corridor-level supply pipeline, commercial density, absorption velocity, and infrastructure activation timelines before capital deployment.
For deeper breakdowns of best sectors to invest in Gurgaon 2026, explore our corridor-level investment research guides.
Final Verdict
Between 2016 and 2026, Gurgaon transitioned from speculative growth to structural maturity.
Appreciation ranged from 50% to 130% depending on corridor.
CAGR bands ranged from 4% to nearly 9%.
Volatility differed dramatically across micro-markets.
The next decade will reward precision — not participation.
Frequently Asked Questions About Gurgaon Property Price Trends (2016–2026)
How much have property prices increased in Gurgaon in the last 10 years?
Property prices in Gurgaon have increased between 50% and 130% over the last decade, depending on the corridor. Premium locations such as Golf Course Road saw stable appreciation near 80–90%, while infrastructure-backed belts like Dwarka Expressway and SPR recorded stronger growth in select sectors. Appreciation has been sector-specific rather than uniform across the city.
What is the 10-year CAGR of Gurgaon real estate?
The 10-year CAGR of Gurgaon real estate generally ranges between 4% and 9% annually. Mature premium corridors delivered steady growth in the 6% range, while emerging infrastructure-driven sectors achieved higher compounded returns after 2021. Corridor-level analysis provides a more accurate picture than city-wide averages.
Which sector in Gurgaon gave the highest capital appreciation from 2016 to 2026?
Sectors along Dwarka Expressway, particularly Sector 113 and Sector 37D, along with parts of Southern Peripheral Road such as Sector 68 and Sector 69, recorded some of the strongest capital appreciation during this period. These areas benefited from infrastructure completion and improved end-user absorption.
Did Gurgaon property prices fall during COVID?
Gurgaon property prices did not experience a broad structural fall during COVID. While transactions slowed in 2020, pricing remained stable in most established corridors. Instead of a crash, the market saw deferred demand that later translated into accelerated growth between 2021 and 2023.
Is Gurgaon still a good long-term property investment after 10 years of growth?
Gurgaon continues to offer long-term investment potential, but growth is now driven by micro-market selection rather than overall city appreciation. Infrastructure-backed corridors with strong commercial presence and supply discipline are better positioned for structured returns over the next decade.


Join The Discussion